Unit 6: Market Failure and the Role of Government
| Created | |
|---|---|
| Tags | In Class |
6.1 - Socially Efficient and Inefficient Market Outcomes
Definitions
- Market Failures A situation in which the free-market system fails to satisfy society’s wants. (When the invisible hand doesn’t work)
- Social Efficiency This is the optimal distribution of resources in society, taking into account all external costs and benefits as well as internal costs and benefits. Occurs where Marginal Social Benefit (MSB) = Marginal Social Costs (MSC).
- Marginal Social Benefit (MSB)
The additional benefit received by all members of society due to the consumption of an additional unit of a good or service.
-
- Marginal Social Cost (MSC)
The additional cost incurred by all members of society due to the consumption of an additional unit of a good or service
-
- Pareto Improvement When at least one individual becomes better off without anyone becoming worse off.
- Pareto Efficiency The idea that there is a point where it is impossible to make anyone better off without making someone worse off. Occurs when an economy is operating on a simple production possibility frontier, it is not possible to increase output of goods without reducing output of services.
Social Efficiency and the Market Equilibrium
The market equilibrium quantity is equal to the socially optimal quantity only when all social benefits and costs are internalized by individuals in the market.
Total Economic Surplus is maximized at that quantity.

Socially Efficient Point
The Socially Efficient Point occurs when you are producing at the quantity and price level where , where all economic surplus is maximized.
If we were to produce either at a quantity above or below the equilibrium, we would be producing at an inefficient point where we are either underproducing or overproducing the good or service. The government sometimes has to take action or make policies to correct these inefficiencies.
Factors that affect Socially Efficient Outcomes
- Externalities
- Market Power (Market Structure)
- Public Goods
- Inequality
6.2 - Externalities
One of the Ten Principles from Chapter 1: Markets are usually a good way to organize economic activity.
In the absence of market failures, the competitive market outcome is efficient and maximizes total surplus. However, there is the possibility for market failures:
One type of market failure is an externality: the uncompensated impact of one person’s actions on the wellbeing of a bystander.
Externalities can be negative or positive, depending on whether impact on bystander is adverse or beneficial.
Self-interested buyers and sellers neglect the external costs or benefit of their actions, so the market outcome is not efficient. In the presence of externalities, government and public policy can often improve outcomes.
Examples of Negative Externalities
- Air pollution from a factory
- The neighbor’s barking dog
- Late-night stereo blasting from the dorm room next to yours
- Noise pollution form construction projects
- Health risk to others from second-hand smoke
- Talking on cell phone while driving makes the roads less safe for others
Graph of a Negative Externality

When a firm chooses to produce a good or service, it does not take into effect the external costs to society. It just looks at its own production costs. This can create a deadweight loss in the graph, where the social cost exceeds the social benefit. The quantity produced in the free market creates a negative social benefit.
Positive Externalities
In the presence of a positive externality, the social value of a good includes:
- private value — the direct value to buyers
- external benefit — the value of the positive impact on bystanders
The socially optimal maximizes welfare:
- At any lower , the social value of additional units exceeds their cost.
- At any higher , the cost of the last unit exceeds its social value.

You can see in the graph above that at the free market quantity (QFM), marginal social benefit (MSB) is greater than marginal private benefit (MPB). This is marked by point C on the graph above. This essentially means that society is experiencing more benefits than the firm at that quantity. Society would like the firm to produce at point B, which is where marginal social benefit (MSB) equals marginal social cost (MSC). By producing at the free market quantity, a deadweight loss is created. This is marked by the triangle ABC on the graph.
Consumers only consider the marginal private benefit (MPB) of consumption, so consumers will consume until MPB = MSC, and that is where the good will be supplied. To account for the spillover benefits, the government provides a per-unit subsidy to consumers for each unit of the good. When this is done, it makes the good less expensive to buyers which increases the demand for the good. Firms will increase the production of the good to the socially optimal quantity to meet the increased demand.
Internalizing the Externality
Internalizing the Externality: altering incentives so that people take account of the external effects of their actions.
When market participants must pay social costs, the market equilibrium will change to meet the social optimum.
(Imposing the tax on buyers would achieve the same outcome: market would equal optimal ).
Effects of Externalities: Summary
If negative externality:
- market quantity larger than socially desirable
If positive externality:
- market quantity smaller than socially desirable
To remedy the problem:
- tax goods with negative externalities
- subsidize goods with positive externalities
Public Policies Toward Externalities
- Command and Control Policies regulate behavior directly. Examples:
- limits on quantity of pollution emitted
- requirements that firms adopt a particular technology to reduce emissions
- Market-based policies provide incentives so that private decision-makers will choose to solve the problem on their own. Examples:
- corrective taxes and subsidies
- tradable pollution permits
Corrective Taxes and Subsidies
- Corrective Tax: a tax designed to induce private decision-makers to take account of the social costs that arise from a negative externality
- Also called Pigouvian taxes after Arthur Pigou (1877-1959).
- The ideal corrective tax = external cost
- For activities with positive externalities, ideal corrective subsidy = external benefit
- Other taxes and subsidies distort incentives and move economy away from the social optimum.
- Corrective taxes & subsidies
- align private incentives with society’s interests
- Different firms have different costs of pollution ab abatement.
- Efficient outcome: Firms with the lowest abatement costs reduce pollution the most.
- A pollution tax is efficient:
- Firms with low abatement costs will reduce pollution to reduce their tax burden.
- Firms with high abatement costs have greater willingness to pay tax.
Corrective Taxes vs. Regulations
Corrective taxes are better for the environment:
- The corrective tax gives firms incentive to continue reducing pollution as long as the costs of doing so is less than the tax.
- If a cleaner technology becomes available, the tax gives firms incentive to adopt it.
- In contrast, firms have no incentive for further reduction beyond the level specified in a regulation.
Private Solutions to Externalities
- The Coase Theorem If private parties can costlessly bargain over the allocation of resources, they can solve the externalities problem on their own.
Why Private Solutions Do Not Always Work
- Transaction Costs The costs parties incur in the process of agreeing to and following through on a bargain. These costs may make it impossible to reach a mutually beneficial agreement.
- Stubbornness Even if a beneficial agreement is possible, each party may hold out for a better deal.
- Coordination problems
6.3 - Public and Private Goods
Public and Common Goods
We consume many goods without paying, such as parks, national defense, clean air and water. When goods have no prices, the market forces that normally allocate resources are absent. Therefore, the private market may fail to provide the socially efficient quantity of these goods.
Important Characteristics of Goods
- A good is excludable if a person can be prevented from using it.
- Excludable: fish tacos, wireless Internet access
- Not excludable: FM radio signals, national defense
- A good is rival in consumption if one person’s use of it diminishes another person’s use.
- Rival: fish tacos
- Not rival: An MP3 file of Kanye West’s donda
Different Kinds of Goods
- Private goods: goods which are both excludable and rival in consumption
- Example: food
- Public goods: goods which are not excludable, and not rival in consumption
- Example: national defense
- Common resources: goods which are rival in consumption, but not excludable
- Example: fish in the ocean
- Club goods: goods which are excludable but not rival in consumption
- Example: cable TV
Public Goods
- Public goods are difficult for private markets to provide because of the free-rider problem.
- Free rider: a person who receives the benefit of a good but avoids paying for it.
- If a good is not excludable, people have incentive to be free riders, because firms cannot prevent non-payers from consuming the good.
- Result: The good is not produced, even if buyers collectively value the good higher than the cost of providing it.
- If the benefit of a public goods exceeds the cost of providing it, the government should provide the good and pay for it with a tax on people who benefit.
- Problem: Measuring the benefit is usually difficult
- Cost-benefit analysis: a study that compares the costs and benefits of providing a public good.
- Cost-benefit analyses are imprecise, so the efficient provision of public goods is more difficult than that of private goods.
- Examples of important public goods:
- National defense
- Knowledge created through basic research
- Fighting poverty
Common Resources
- Like public goods, common resources are not excludable
- Cannot prevent free-riders from using them
- Little incentive for private firms to produce
- Role for government: seeing that they are provided
- Additional problem with common resources: rival in consumption
- Each person’s use reduces others’ ability to use
- Role for government: ensuring they are not overused
The Tragedy of the Commons
- A parable that illustrates why common resources get more use than is socially desirable.
- Setting: a medieval town where sheep graze on common land
- As the population of the town grows, so does the number of sheep in the town
- The amount of land is fixed, the grass begins to disappear from overgrazing
- The private incentives (using the land for free) outweigh the social incentives (using it carefully)
- Result: People can no longer raise sheep
- The tragedy is due to an externality: Allowing one’s flock to graze on the common land reduces its quality for other families.
- People neglect this external cost, resulting in overuse of the land
Policy Options to Prevent Overconsumption
- Regulate the resource
- Impose a corrective tax to internalize the externality
- Example: hunting and fishing licenses, entrance fees for congested national parks
- Auction off permits allowing use of the resource
- Example: Spectrum auctions by the U.S. FCC
- If the resource is land, convert to a private good by dividing and selling parcels to individuals
Conclusion
- Public goods tend to be under-provided, while common resources tend to be over-consumed.
- These problems arise because property rights are not well-established:
- Nobody owns the air, so no one can charge polluters. Result: too much pollution
- Nobody can charge people who benefit from national defense. Result: too little defense
- The government can potentially solve these problems with appropriate policies.
6.4 - The Effects of Government Intervention in Different Market Structures
Perfect Competition
In a perfectly competitive market, a tax will shift the supply curve to the left, resulting in a new higher price, a lower quantity demanded, and an associated deadweight loss:

A subsidy in a perfectly competitive market will shift the supply curve to the right, resulting in a new lower price, a higher quantity demanded, and an associated deadweight loss:

Natural Monopoly
A natural monopoly is a market where the most efficient number of firms in the industry is only one. This is often due to high start-up costs. An example of a natural monopoly would be an electric company; it is more efficient for 1 firm to provide power to an entire city rather than having multiple firms with overlapping power grids.
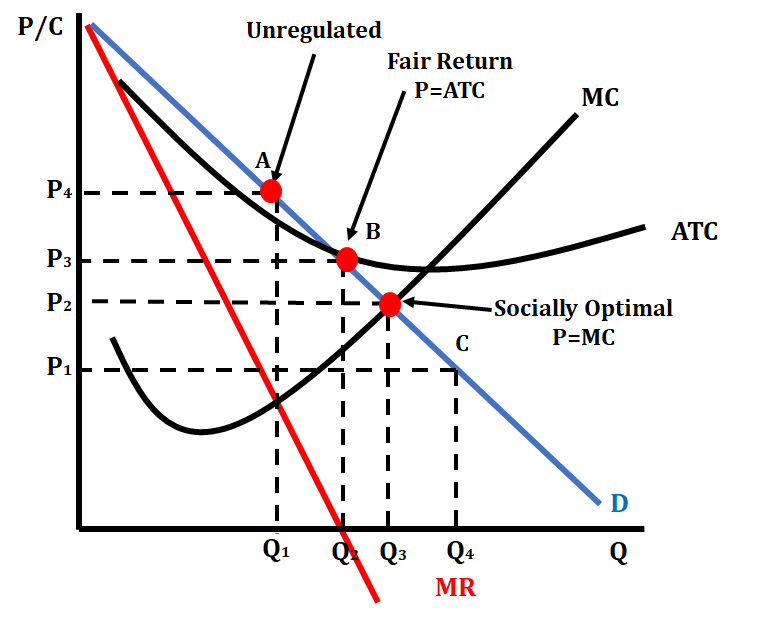
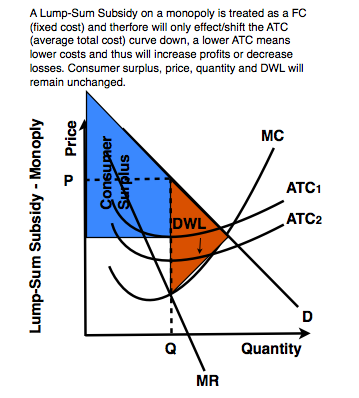
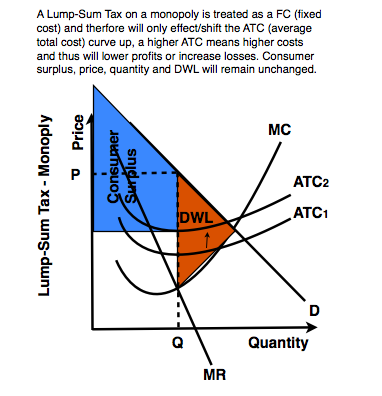
The graph above shows a natural monopoly. Point A is where a monopoly would produce when they are unregulated by the government. Point B represents the fair-return point, where the monopoly would earn a normal economic profit or break even. Point C represents the perfectly competitive or socially optimal point on a monopoly graph. There is no deadweight loss at Point C.
The government can set a price ceiling that can cause a natural monopoly to produce the socially optimal output. The monopoly will need a lump-sum subsidy to produce here.
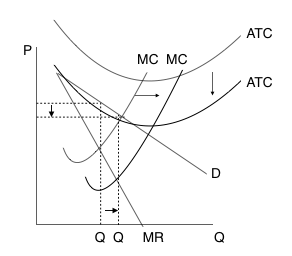
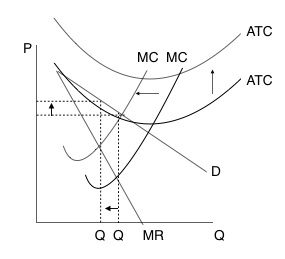
Per-unit taxes and subsidies affect variable costs, thus affecting the , , and curves, while lump-sum taxes and subsidies only affect fixed costs, thus affecting only the and curves.
A lump-sum tax will cause an upward shift in the and curves, while a lump-sum subsidy will cause a downward shift in the and curves.
A per-unit tax will cause an upward shift in the and curves, as well as a leftward shift in the curve. A per-unit subsidy will cause a downward shift in the and curves, as well as a rightward shift in the curve.
6.5 - Inequality
There are two types of economic inequality: (1) income inequality, and (2) wealth inequality. Income inequality looks at how annual earnings are distributed and wealth inequality looks at how assets are distributed.
There are several sources of these two types of inequality:
- Tax Structure
- Human Capital (training and skills)
- Social Capital
- Inheritance
- Effects of Discrimination
- Access to Financial Markets
- Mobility
- Bargaining Power within Economic and Social Units
Income Inequality
Governments use simulation to measure the income inequality level. A graph known as the Lorenz Curve can be used to graphically represent income inequality.
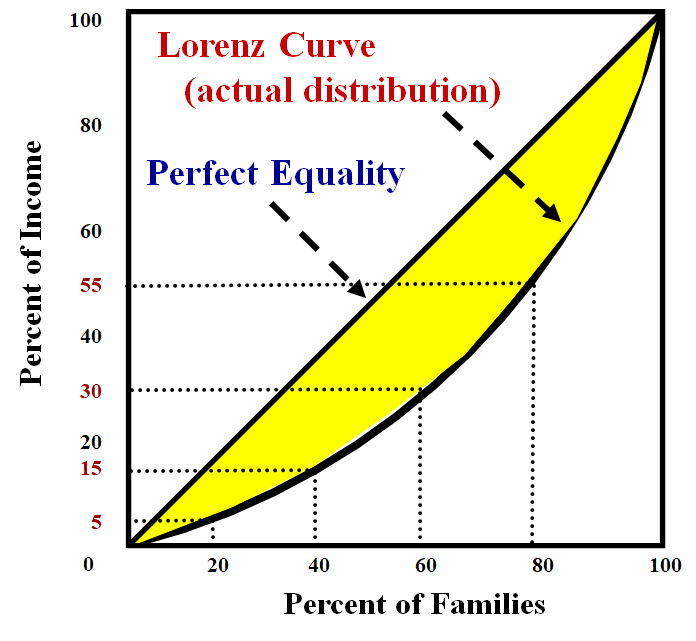
The Lorenz curve shows the actual income distribution in a society. The larger the gap between perfect equality and the Lorenz curve, the greater the amount of income inequality that exists.
The Gini Coefficient is a numerical measurement of income inequality. It is a statistical measurement of income equality where perfect equality is 0 and perfect inequality is 1. The government can help with income inequality by either increasing the amount it taxes wealthier citizens or by increasing transfer payments to the poor. Transfer payments are government payments to individuals or businesses designed to meet a specific objective rather than pay for goods or resources (Ex: welfare).
Types of Taxes
There are several types of taxes that can contribute to or help with income inequality:
- Progressive taxes take a larger percentage of income from high-income groups than from
low-income groups.
- The most common example of a progressive tax is the Federal Income Tax System in the United States. This system divides people into tax brackets based on their income level, and taxes people increasing amounts as income increases. To demonstrate, someone making between $0 and $14,100 this year is taxed 10% of that income, while someone making between $14,101 and $53,700 this year is taxed 12% of that income.
- Regressive taxes take a larger percentage from low-income groups than from high-income
groups.
- The most common example of a regressive tax is sales tax in the United States. Let's say the sales tax is 5% in a state, and Sally and Bob both spend $200 in sales taxes. Sally only makes $10,000 a year, so this $200 takes a larger percentage of her income than Bob, who makes $100,000 a year. Although this sales tax is the same for everyone, someone in a low-income group will feel the burden of this tax more than someone in a high-income group.
- Proportional taxes takes the same percentage of income from all income groups.
- For example, if there was a 20% flat income tax on all income groups, each income group is equally affected by the tax.
