Unit 5: Factor Markets
| Created | |
|---|---|
| Tags |
5.1 - Introduction to Factor Markets
Key Vocabulary
Marginal Product
The additional product that is produced by each additional input. We calculated this number by dividing the change in the total product by the change in the number of inputs.
Total Revenue
This is calculated by price times the total product.
Marginal Revenue Product (MRP)
The change in total revenue resulting from employing an additional unit of a resource (e.g. labor).
Marginal Resource Cost (MRC)
The additional cost incurred by hiring or employing one more unit of the resource.
Hiring Labor and Other Resources
The rule for hiring labor and any other resources is that firms will continue to hire workers and resources as long as marginal revenue product (MRP) > marginal resource cost (MRC) and until marginal revenue product (MRP) = marginal resource cost (MRC). A firm will never hire when marginal resource cost (MRC) > marginal revenue product (MRP).
This is just like profit maximization, where . In the Factor Market, we say that .
5.2 - Changes in Factor Demand and Factor Supply
Changes in Factor Demand
The demand curve for a resource can shift, based on chances in the following determinants:
- Demand for the product
- Productivity of the resource
- Changes in the Prices of Other Resources
- Substitute Resources
- Complementary Resources
Demand for the Product
Change in the demand for the good or service can cause a shift in demand in the factor market. For example, if there is an increase in the demand for pizza, then there will be greater demand for all the resources that are involved in the production of pizza, including cheese, sauce, dough, and workers. Resource demand can also change when the price of a product changes. For example, if the price of pizza decreases, then the worker who is trained to make a pizza generates a smaller MRP (because MRP = MP x price), so the demand for these workers will decrease.
Productivity of the Resource
A change in productivity can also cause a shift in demand in the factor market. Let's take a situation where a new technique is developed that cuts production time in half. Since labor productivity has increased, each worker can make a greater quantity of the goods than they used to. This leads to each worker generating a greater marginal revenue product which increases their value to the firm or business. As a result, this increases the demand for labor.
Price of Related Inputs
A change in the price of related inputs can also shift the demand in the factor market. In this determinant, we are referring to substitute resources and complementary resources that are used in the production of goods and services. If the price of one resource becomes more expensive, the firm will increase their demand for the substitute resource. For example, if the price of copper piping increases, home builders will more willing to demand plastic piping. In looking at complementary resources, we can look at the production of soft drinks. Both aluminum and sugar are used in the production of soft drinks. If the price of aluminum increases, then we would see the demand for sugar decrease since both products are used to produce soft drinks.
Graphing Change in Factor Demand


Factor Supply
Just like with the demand for resources, there are several things that can change the supply of resources. When we are looking at the supply of resources, we generally focus on workers.
Number of Qualified Workers
The number of qualified workers that are available in a particular industry is one determinant of supply in the factor market. This can be influenced by immigration, education, training, and abilities. Here are some examples of this determinant:
- If a country enacts stricter immigration laws than that will shift the labor supply to the left because of the smaller pool of workers.
- The number of graduates with engineering degrees soar. This would cause the labor supply to shift right.
Government Regulations and Licensing
The second determinant of the supply of workers is government regulations and licensing. Here are some examples of this determinant:
- If the government establishes a certification process that makes it harder to be an electrician than we would see the supply of electricians decrease shifting the labor supply curve to the left.
Change in Societal Values
The third determinant is personal values regarding leisure time and societal roles. Here are some examples of this determinant.
- The increase in the labor force, especially women, during WWII because people saw it as a patriotic duty to help produce the goods that would help in the war efforts. This would increase the labor supply and shift the curve right.
- Low-skill workers decide that working at minimum wage isn't worth their time. This would shift the labor supply curve to the left due to the decrease in the amount of workers.
Graphing Change in Factor Supply

5.3 - Profit-Maximizing Behavior in Perfectly Competitive Factor Markets
There are two types of factor markets. The first type is what is known as a perfectly competitive factor/resource market. There is significant use of labor as the type of factor (resource) in describing this type of factor market in AP Micro.
Characteristics of Perfectly Competitive Labor (Factor) Markets
Perfectly competitive labor (factor markets) are very similar the perfectly competitive market structure EXCEPT that we are dealing with resources instead of goods and services.
The characteristics of this type of factor (resource) market include:
- Many, small firms hiring workers
- Workers are "wage takers"
- Skill level of workers is identical (i.e. workers are perfect substitutes)
- Firms can hire as many workers as they need or want at the wage set in the market
- Firms will hire workers as long as , or until . in this type of factor market.
Perfectly Competitive Labor Market Graphs
In the perfectly competitive labor market, there is a downward-sloping demand curve because of the law of diminishing marginal returns. This means that each additional worker generates less revenue (MRP), and, therefore, is worth less to the firm. The supply curve for the labor market graph is upward-sloping because of the incentive to earn higher wages and greater income. If there are higher wages, it gives workers the incentive to give up leisure time and offer more of their time as workers. The same can be said for lower wages, which will deter workers from wanting to work more.

Firm Graph in a Perfectly Competitive Labor Market
The perfect labor market firm graph looks a little different than it did in the product market. The demand for labor, otherwise known as , is downward sloping. The supply of labor, otherwise known as MRC, is perfectly elastic. This shows that workers are wage takers and that firms hire all workers at the same wage level set by the market. The quantity of labor that each individual firm will hire is where .

Relating the Market and Firm Graphs
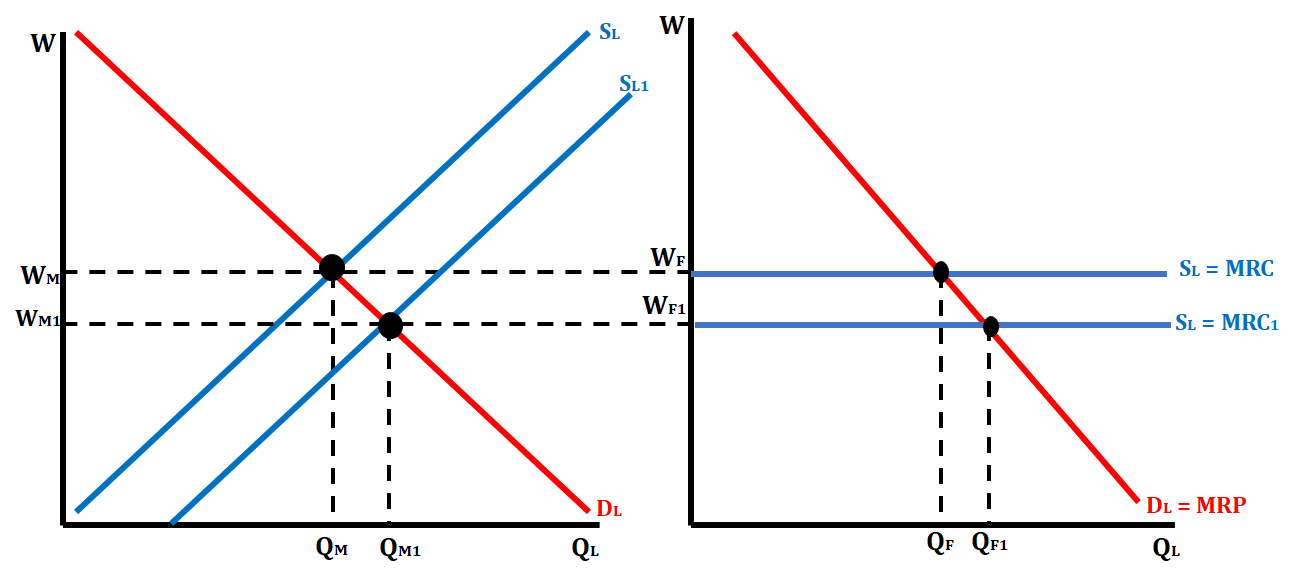
When there is a change in the market graph for either labor demand or labor supply, we have to show the corresponding changes in the firm graph. For example, if the supply of labor increases, that means the equilibrium wage will decrease. This will move the curve in the firm graph down and increase the number of workers each firm will hire. The graph below illustrates this change.
Cost Minimizing Combination of Resources
During the production process, firms must be careful to choose a combination of resources that will minimize their costs. This is sometimes referred to as the Least-Cost Rule. In order for a firm to be using the combination of resources that will reduce its costs, they have to satisfy the following formula.
Where is marginal product and is price. The and represent different resources.
Profit-Maximizing Combination of Resources
Another method that firms can look at when determining the combination of resources that they can use is what is known as the profit-maximizing rule for combining resources. In order to adhere to this rule, the firm must satisfy the following formula:
This means that the firm is hiring where for each resource. If they are not currently at this particular point for each resource, they can either increase or decrease the number of resources they use to satisfy this formula and the rule.
5.4 - Monopsony Markets
A monopsony market is a type of imperfectly competitive factor (resource) market where only a single firm buys resources.
Characteristics of Monopsonies
- One, large firm hires all workers in a single labor market and is large enough to control the labor market.
- The market is imperfectly competitive.
- The firm is a wage maker.
- Firms must increase wages in order to hire additional wages.
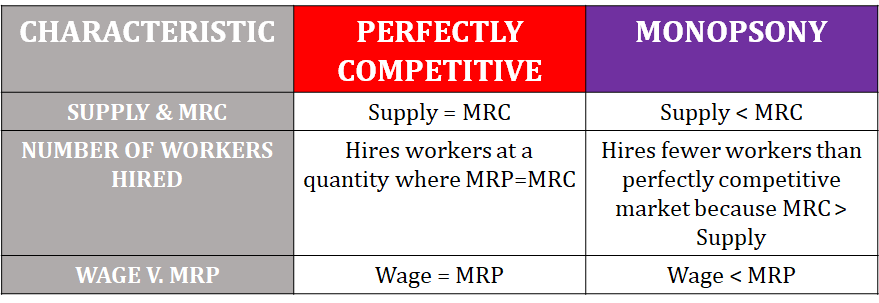
- MRC > wage per worker (This is because when you hire an additional worker, you must pay them a higher wage than the previous worker. However, you cannot wage discriminate, so you not only have the additional cost of that worker, but also the cost of bringing all the earlier workers up to the current wage rate).
- The firm will hire the quantity of labor where .
- The firm will pay workers a wage that they are willing and able to work for below their .
Differences between Perfect Competition and Monopsony
Graphing a Monopsony Market
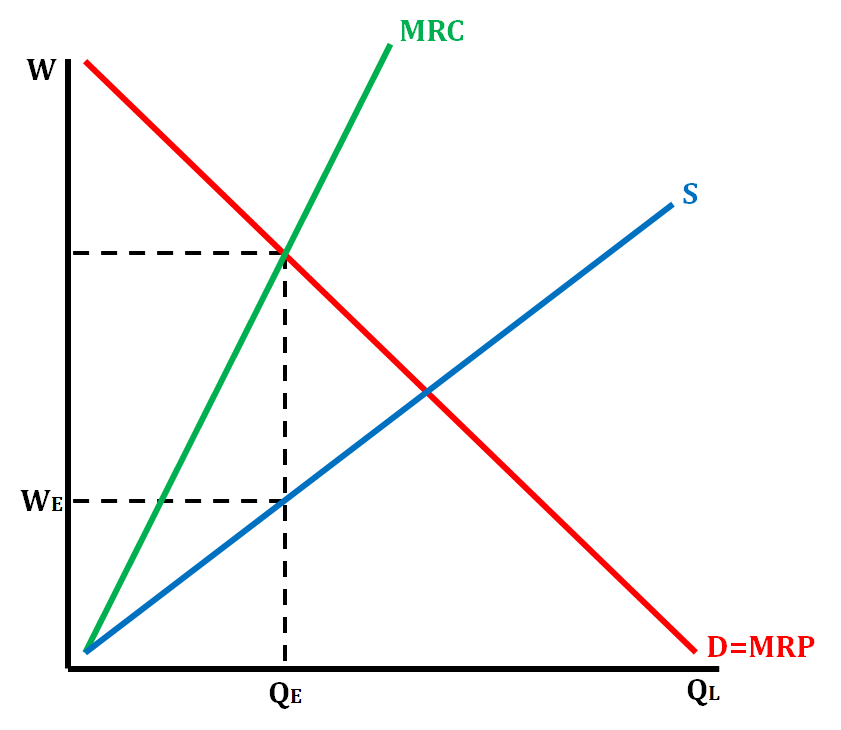
In a monopsony, is greater than , and thus appears to the left graphically. We determine the number of workers by finding where and then going down to the horizontal axis. We determine wage by finding and then going down to the supply curve and over to the vertical axis.
The competitive solution would result in a higher wage and greater employment than the monopsonistic labor market. Monopsonists maximize profits by hiring a smaller number of workers and thereby paying a less-than-competitive wage rate.
5.5 - Unions and Collective Bargaining
Unions attempt to monopolize the sale of labor, so the competitive model breaks down in this case. Union membership is only a small and declining portion of the American labor force, however.
Unionization is much less prevalent in America than it is in most other industrialized countries.
Unions as Labor Monopolies
Unions cam monopolize the supply of labor, but they are not all powerful.
Unions try to increase the demand for their labor.
- Featherbedding: forcing management to employ more workers than they really need
- Institute a campaign to increase worker productivity
- Raise the demand for the company’s product
- Flex political muscle (for example, by obtaining legislation to reduce foreign competition)
- Appeal to the public to buy union products
Three Union Models
Demand Enhancement Model
Increase worker wages by increasing product / derived demand, increasing worker productivity, and by increasing the price of substitute labor.
Exclusive or Craft Model
Use restrictive membership policies, restrictions of the labor supply of the economy, and occupational licensing to reduce the supply of qualified laborers.
Inclusive or Industrial Model
Focuses on organizing virtually all workers and thereby controlling the supply curve for labor.
Wage Increases and Unemployment
- Union members receive about 15-20% higher wages on average
- Negative impact on the level of employment
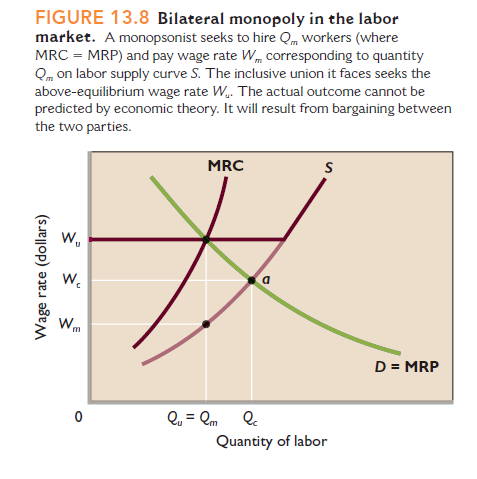
Bilateral Monopoly Model in the Labor Market
Economic theory cannot determine the actual outcome of a bilateral monopoly in the labor market. The actual wage will be determined through bargaining between the labor union and the monopolist.
Minimum Wage Controversy
A minimum wage acts as a government-enforced price floor in the factor market. This has the potential to create a labor surplus, where supply for labor is greater than the demand for labor.
Additional Factor Market Concepts
The Determination of Rent
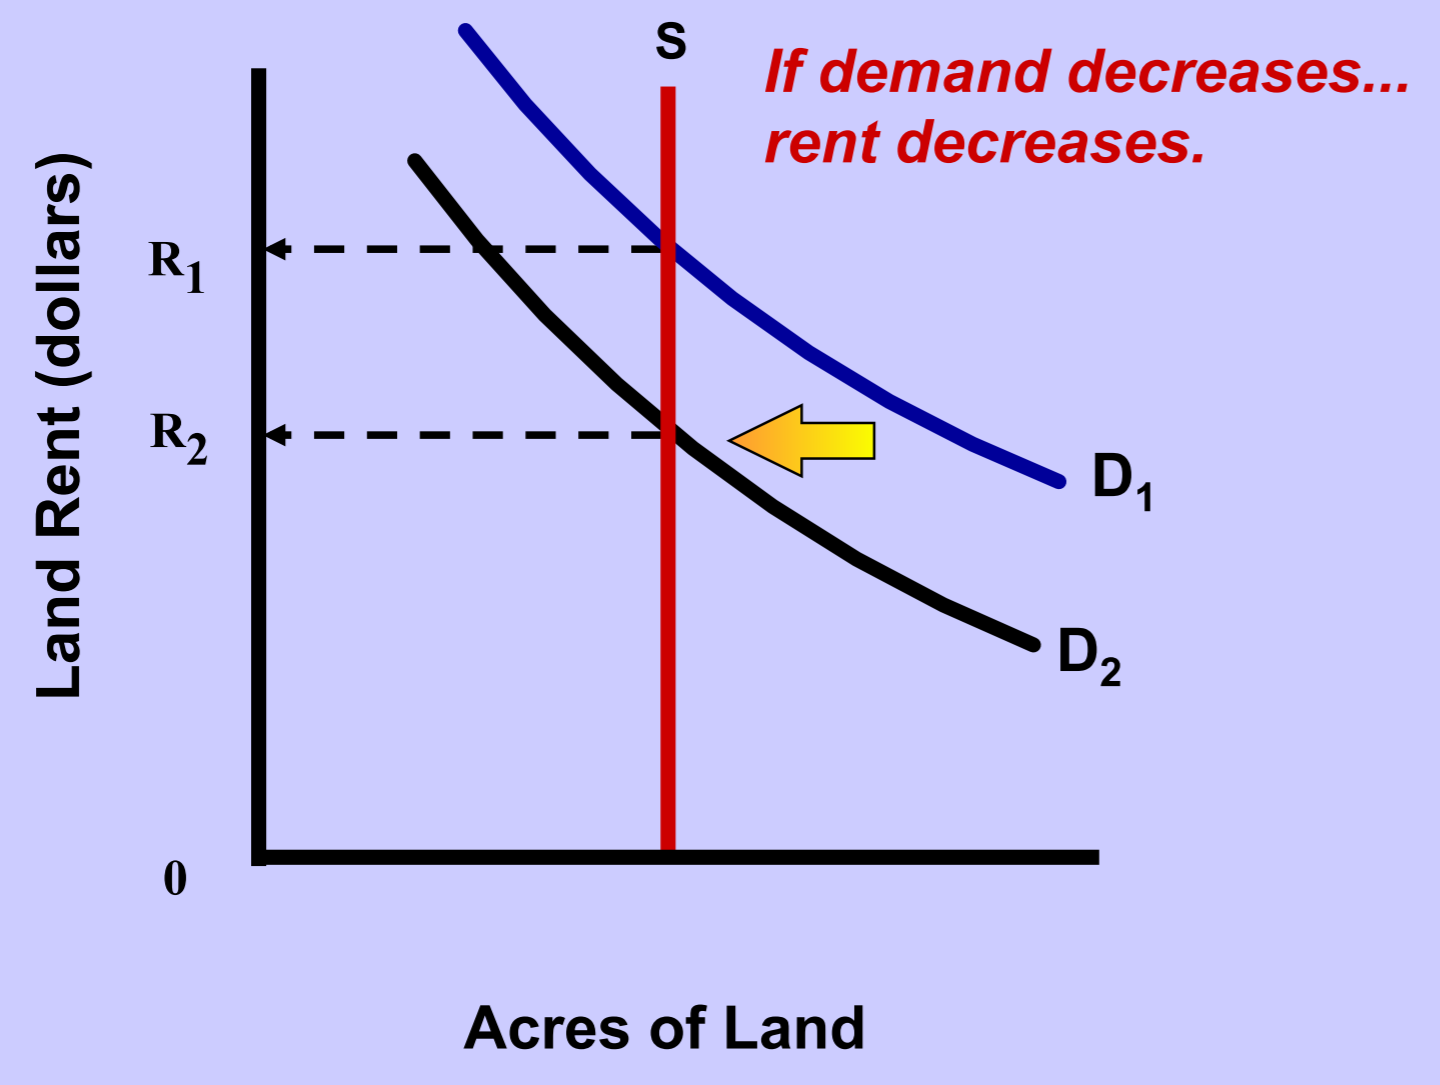
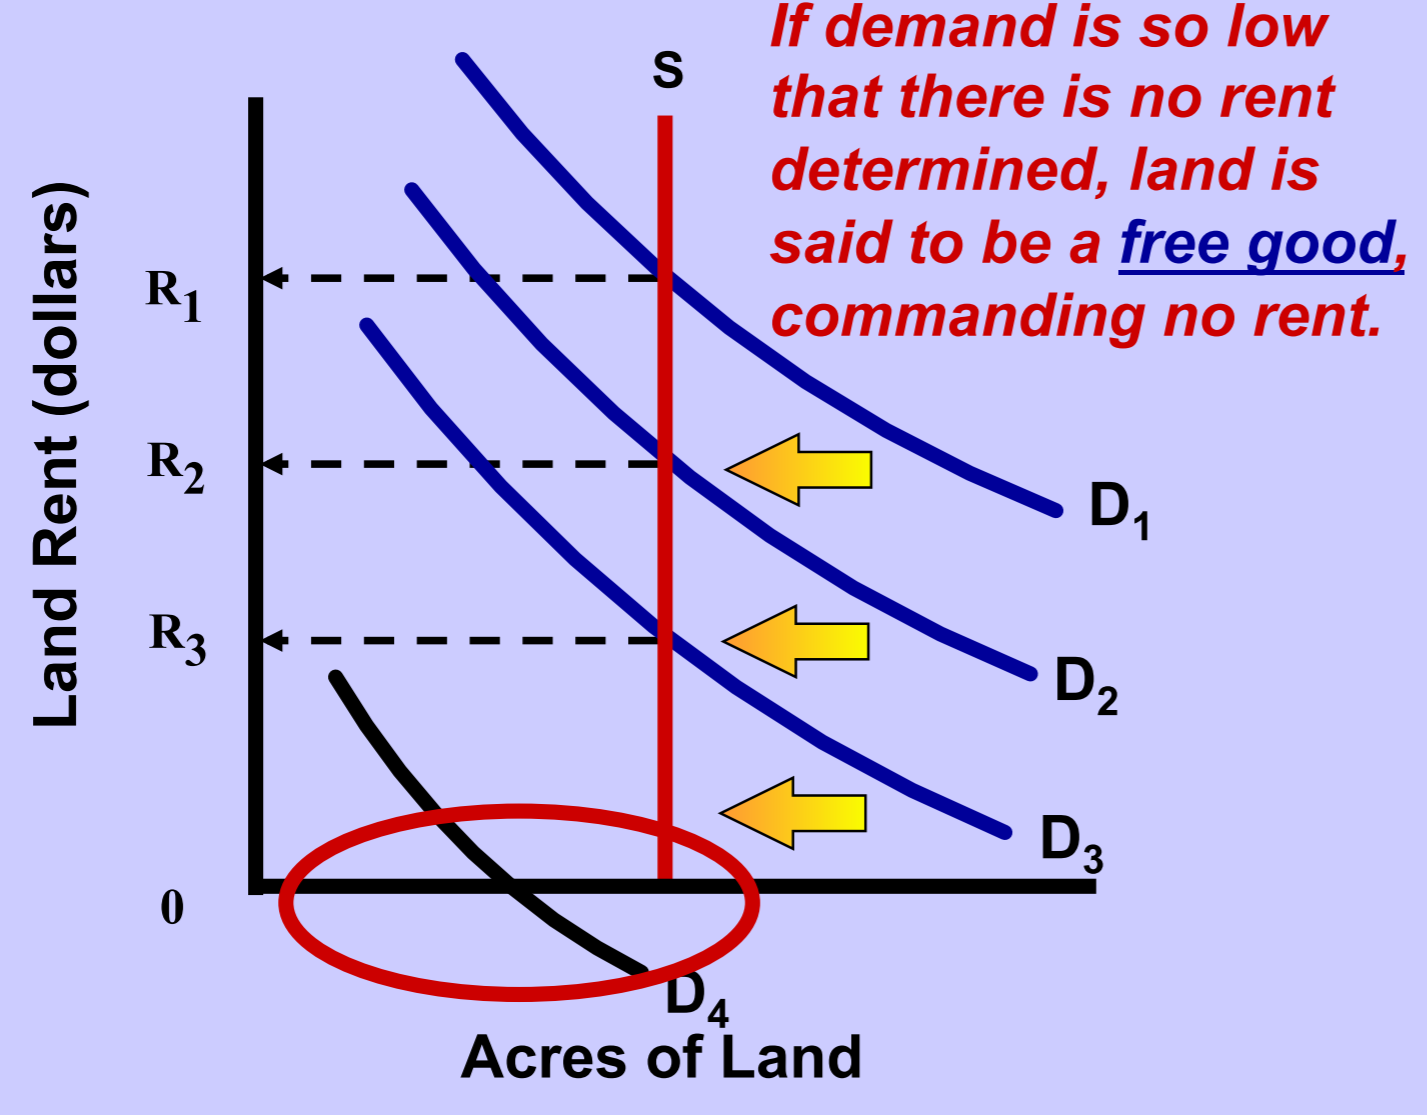
Some resources (like land) are fixed. is the only active determinant of land rent.
Economic rent: an “extra” payment for a factor of production (such as land) that does not change the amount of the factor that is supplied.
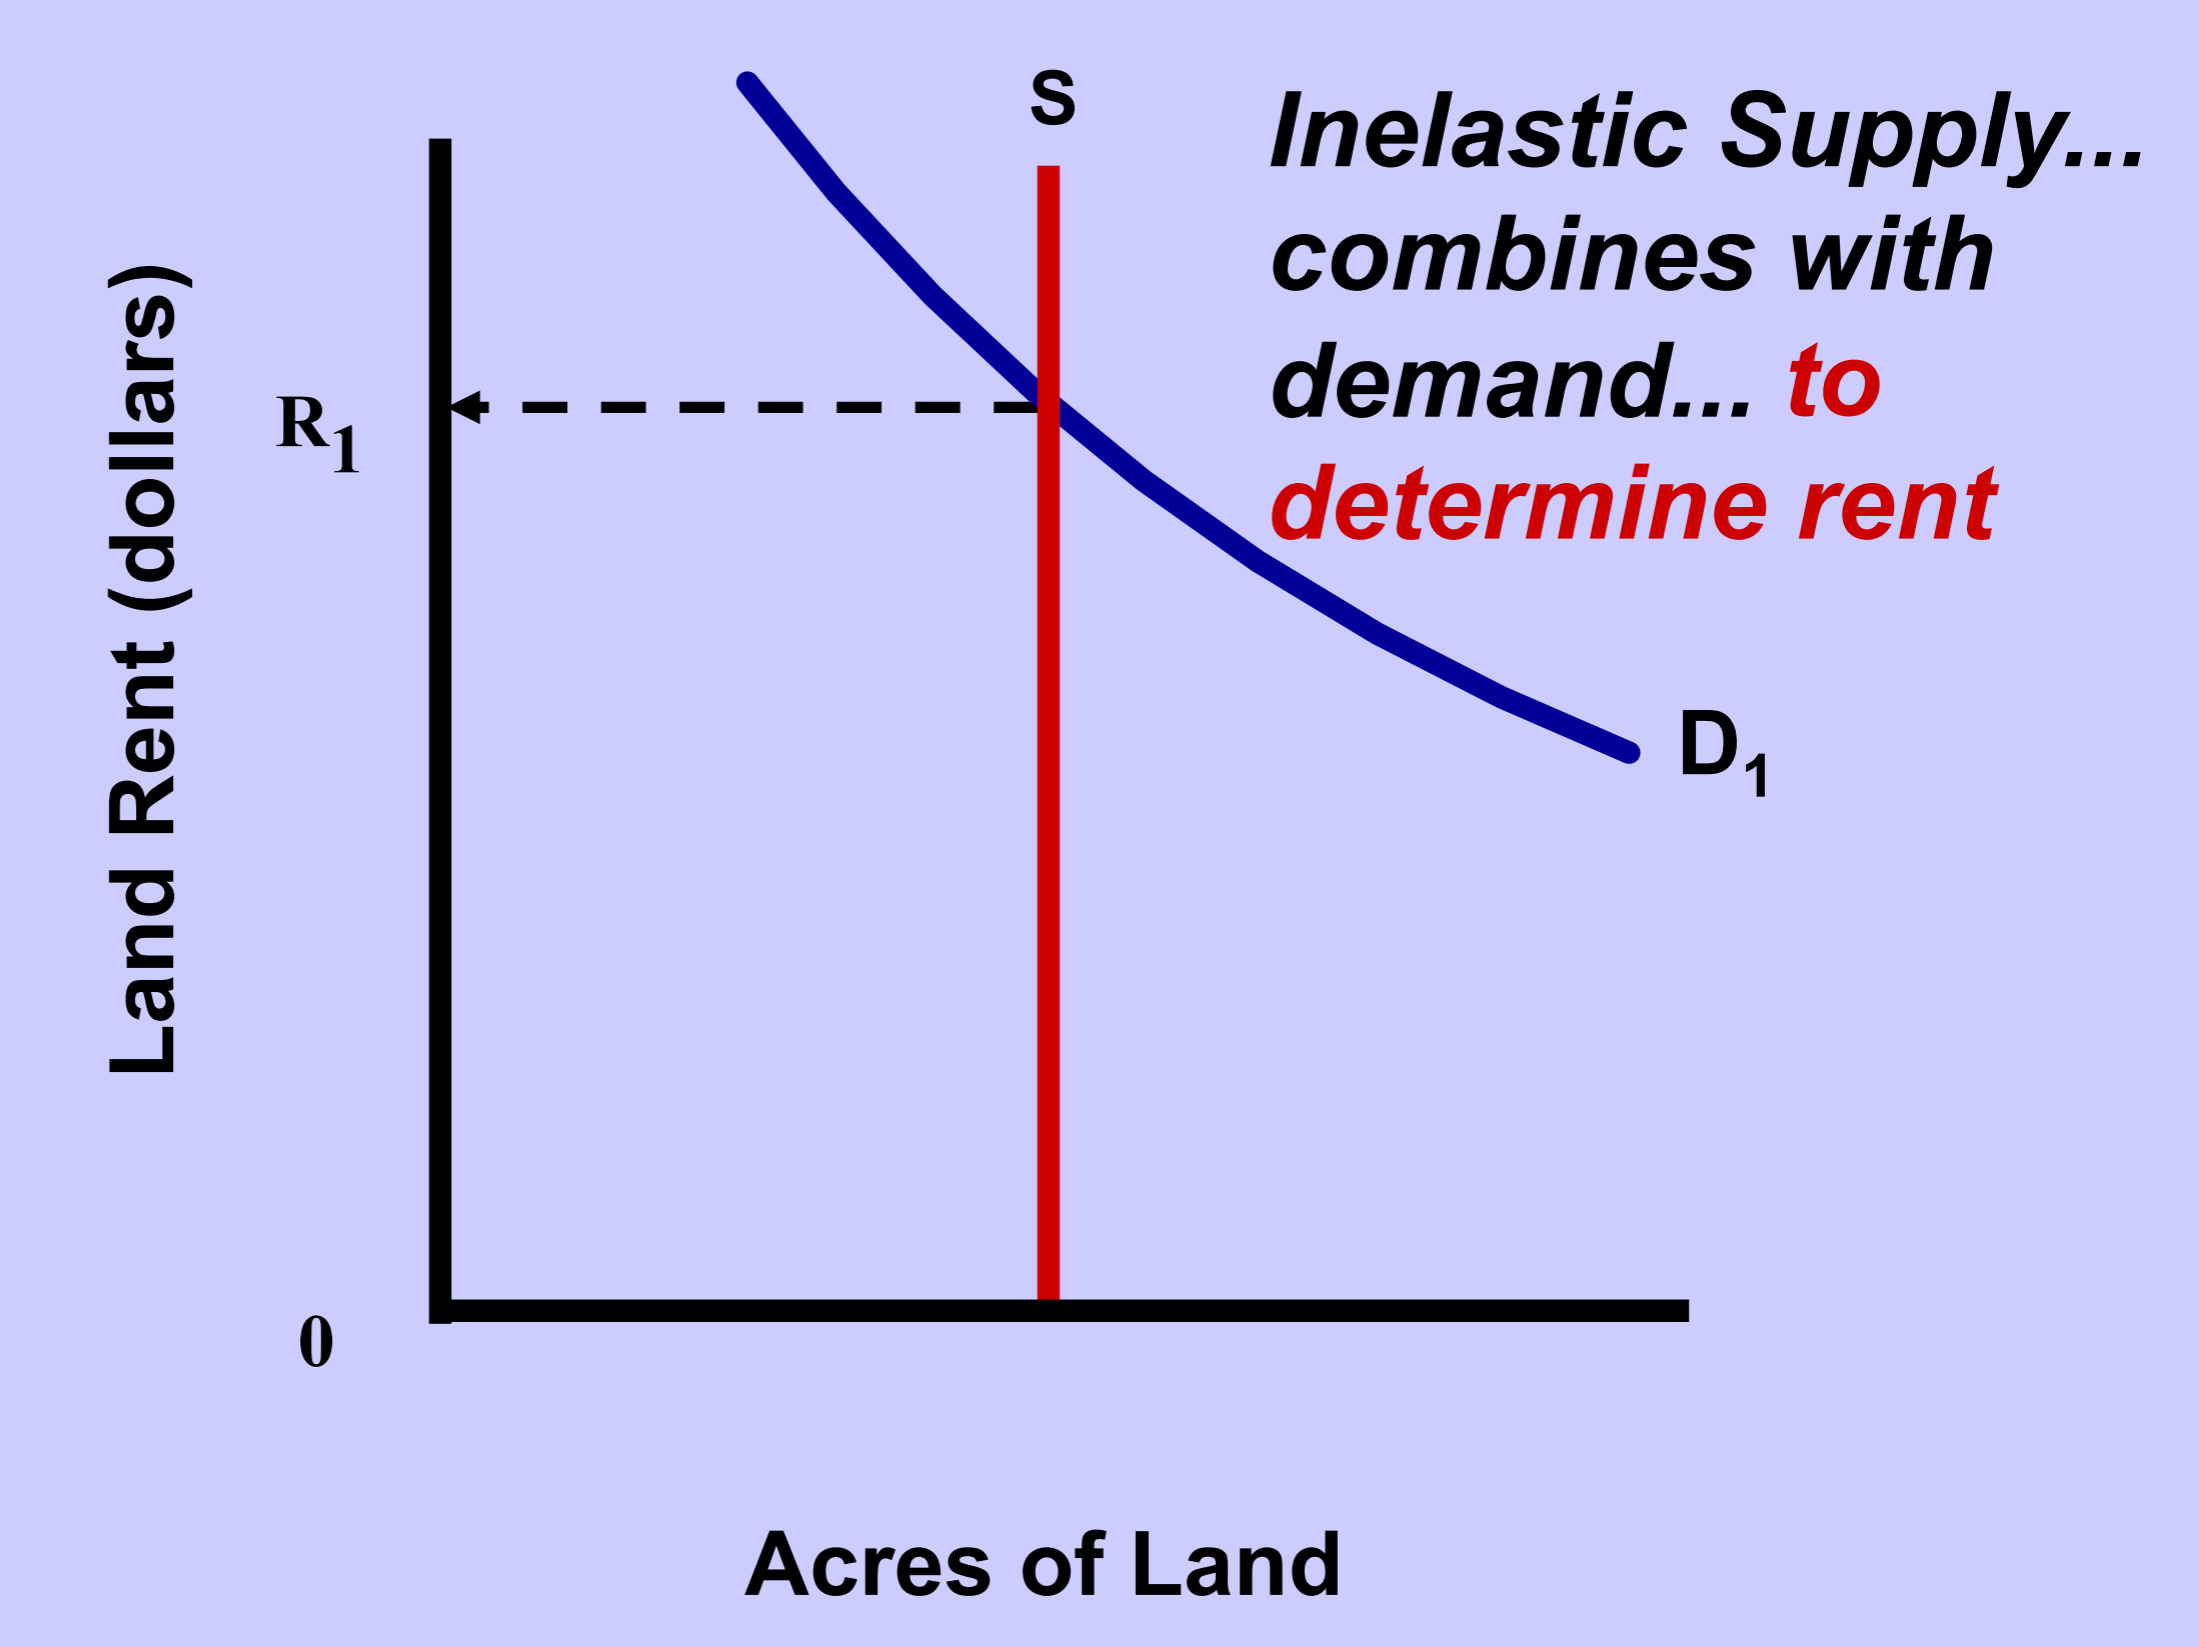
If demand decreases, rent decreases.
Entrepreneurship and Profit
- When economists calculate profits, they consider both explicit and implicit costs.
- Essentially, profits are what remains from revenue after all other factors have been paid.
Risk and Profit
There are two types of risks in business, insurable risks and uninsurable risks. While most risks are insurable, risks like changes in economy, structural changes, government policy, and rival producers are examples of uninsurable risks.
Clarification of Resources
Money is NOT a resource. You cannot directly produce any goods or services with it. Money can, however, be used to fund the acquisition of productive resources.
